
FTMO MT5 Strategy Tester evidence
AurumTwelve12 XAU
v1.32 MT5 Backtest
The complete MT5 tester workbook and equity graph, published with the verified test dates and risk figures from the report.

Read directly from the tester workbook
MT5 backtest summary
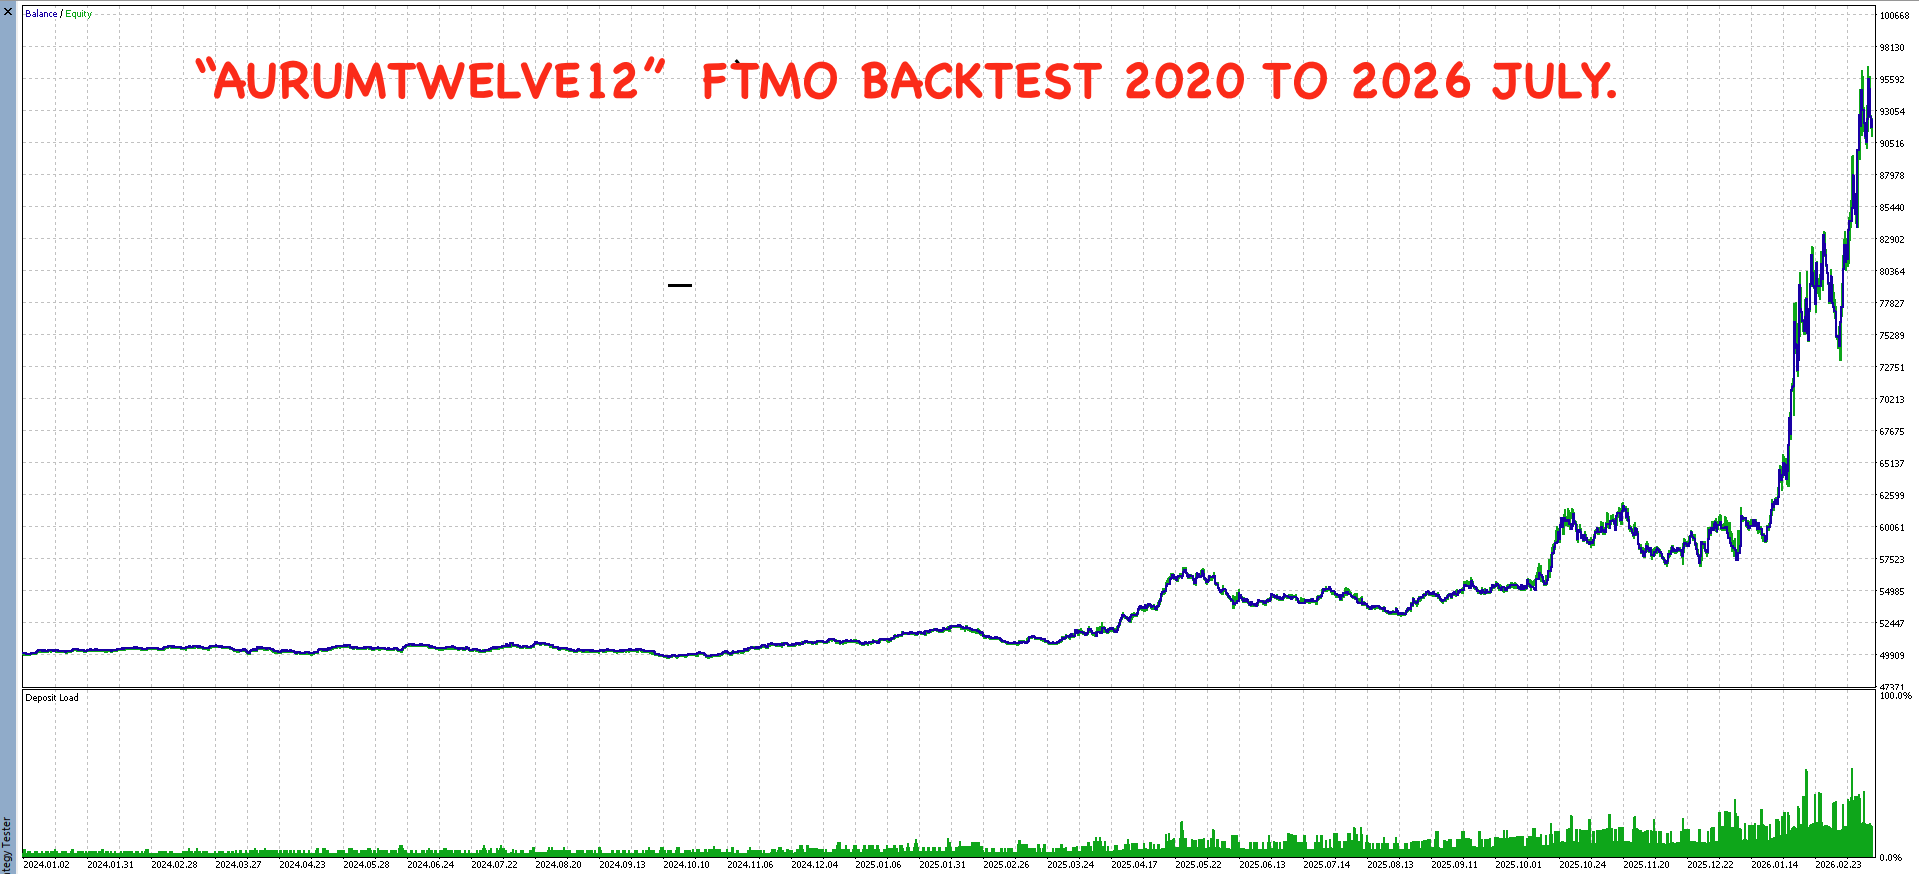
The uploaded filename and handwritten graph title mention 2020, but the actual tester Period field and graph axis start on 1 January 2024. The verified dates are used here.
Balance and equity curve
Growth path and drawdown evidence
The supplied graph is cropped on the page to remove the incorrect handwritten 2020 label; the original screenshot remains downloadable for provenance.

The curve is relatively quiet through 2024, accelerates in 2025, and becomes substantially more volatile in early 2026. That late acceleration also coincides with the report’s 12.14% maximum equity drawdown, so the return should be read together with the risk.
Backtest and risk disclosure
This is a historical simulation, not a live statement or promise of future performance. The 12.14% maximum equity drawdown exceeds the overall loss allowance used by many prop-firm challenge structures, so this exact test should not be described as automatically FTMO compliant despite running on FTMO-Demo data.
Source: MT5 Strategy Tester workbook supplied 13 July 2026, FTMO-Demo build 5833.